Automated Marketing Reports: What They Actually Look Like
The Friday afternoon marketing report is one of the most expensive habits in B2B SaaS marketing. Not expensive in software cost, expensive in what it prevents. Four hours of data assembly is four hours of not running experiments, not reviewing pipeline signals, not making the decisions that actually move the number.
Sales professionals dedicate just 30% of their time to revenue-generating activities, the remaining 70% is consumed by administrative tasks, data entry and non-selling functions, according to the Salesforce State of Sales Report. The same pattern applies to marketing. The senior marketer who should be designing experiments and reviewing pipeline is spending Friday afternoon reconciling timezone mismatches between Google Ads and HubSpot.
Automated marketing reports fix this at the structural level, not by making manual reporting faster, but by eliminating the assembly stage entirely. The Agentic Marketing Engine pulls data from Google Ads, LinkedIn, HubSpot, Search Console and GA4, aligns it, diagnoses anomalies, surfaces recommended actions, and builds the report before the marketer opens their laptop. Review takes 20 minutes. Every recommended action waits for approval before executing.
This post covers exactly what the automated report contains, how the agent builds it, and what you do with the four hours you get back.
At a Glance
-
The four-hour Friday report is a data assembly problem not a reporting problem. Automated marketing reports eliminate assembly, the marketer reviews and approves in 20 minutes.
-
Data integration is the number one challenge for 58% of B2B martech users, more than lack of expertise or budget constraints, according to Chiefmartec 2026. The integration problem is what makes manual reporting expensive. Connect the sources once and the assembly problem disappears.
-
The automated report does not just show data. It surfaces what changed, diagnoses why, and recommends what to do, all waiting for the marketer's approval before executing.
-
Companies with integrated sales and marketing data in their CRM report 38% higher win rates, according to Aberdeen Group research. The pipeline connection, linking campaign data to HubSpot deal records, is what makes the report a revenue tool rather than an activity summary.
-
Human approval stays at every step. The Strivelabs agent builds the report and surfaces recommended actions. The marketer decides what executes.
Why Marketing Reports Take 4 Hours to Build Every Week
The time does not go on analysis. It goes on alignment, making data from five different platforms speak the same language before any analysis can begin.
Google Ads and LinkedIn handle date ranges differently. GA4 conversion events use different naming conventions from HubSpot contact records. Search Console data has a 48-72 hour delay that creates false negatives in weekly comparisons. Campaign names that appear as "Q2_Brand_EMEA" in Google Ads appear as "q2-brand-emea" in HubSpot and as an untagged direct visit in GA4 because someone forgot to add UTMs to the landing page.
Before a single insight can be written, the marketer spends two hours on alignment. Then another hour cross-referencing CRM records against ad spend to build the pipeline attribution view. Then another hour turning raw numbers into a narrative that leadership can act on.
The result: a four-hour report that is already 72 hours stale by the time leadership reads it on Monday. A campaign that started underperforming Thursday has been running for five days before anyone notices. In a 90-day B2B SaaS sales cycle where every pipeline decision compounds, five days of delay matters.
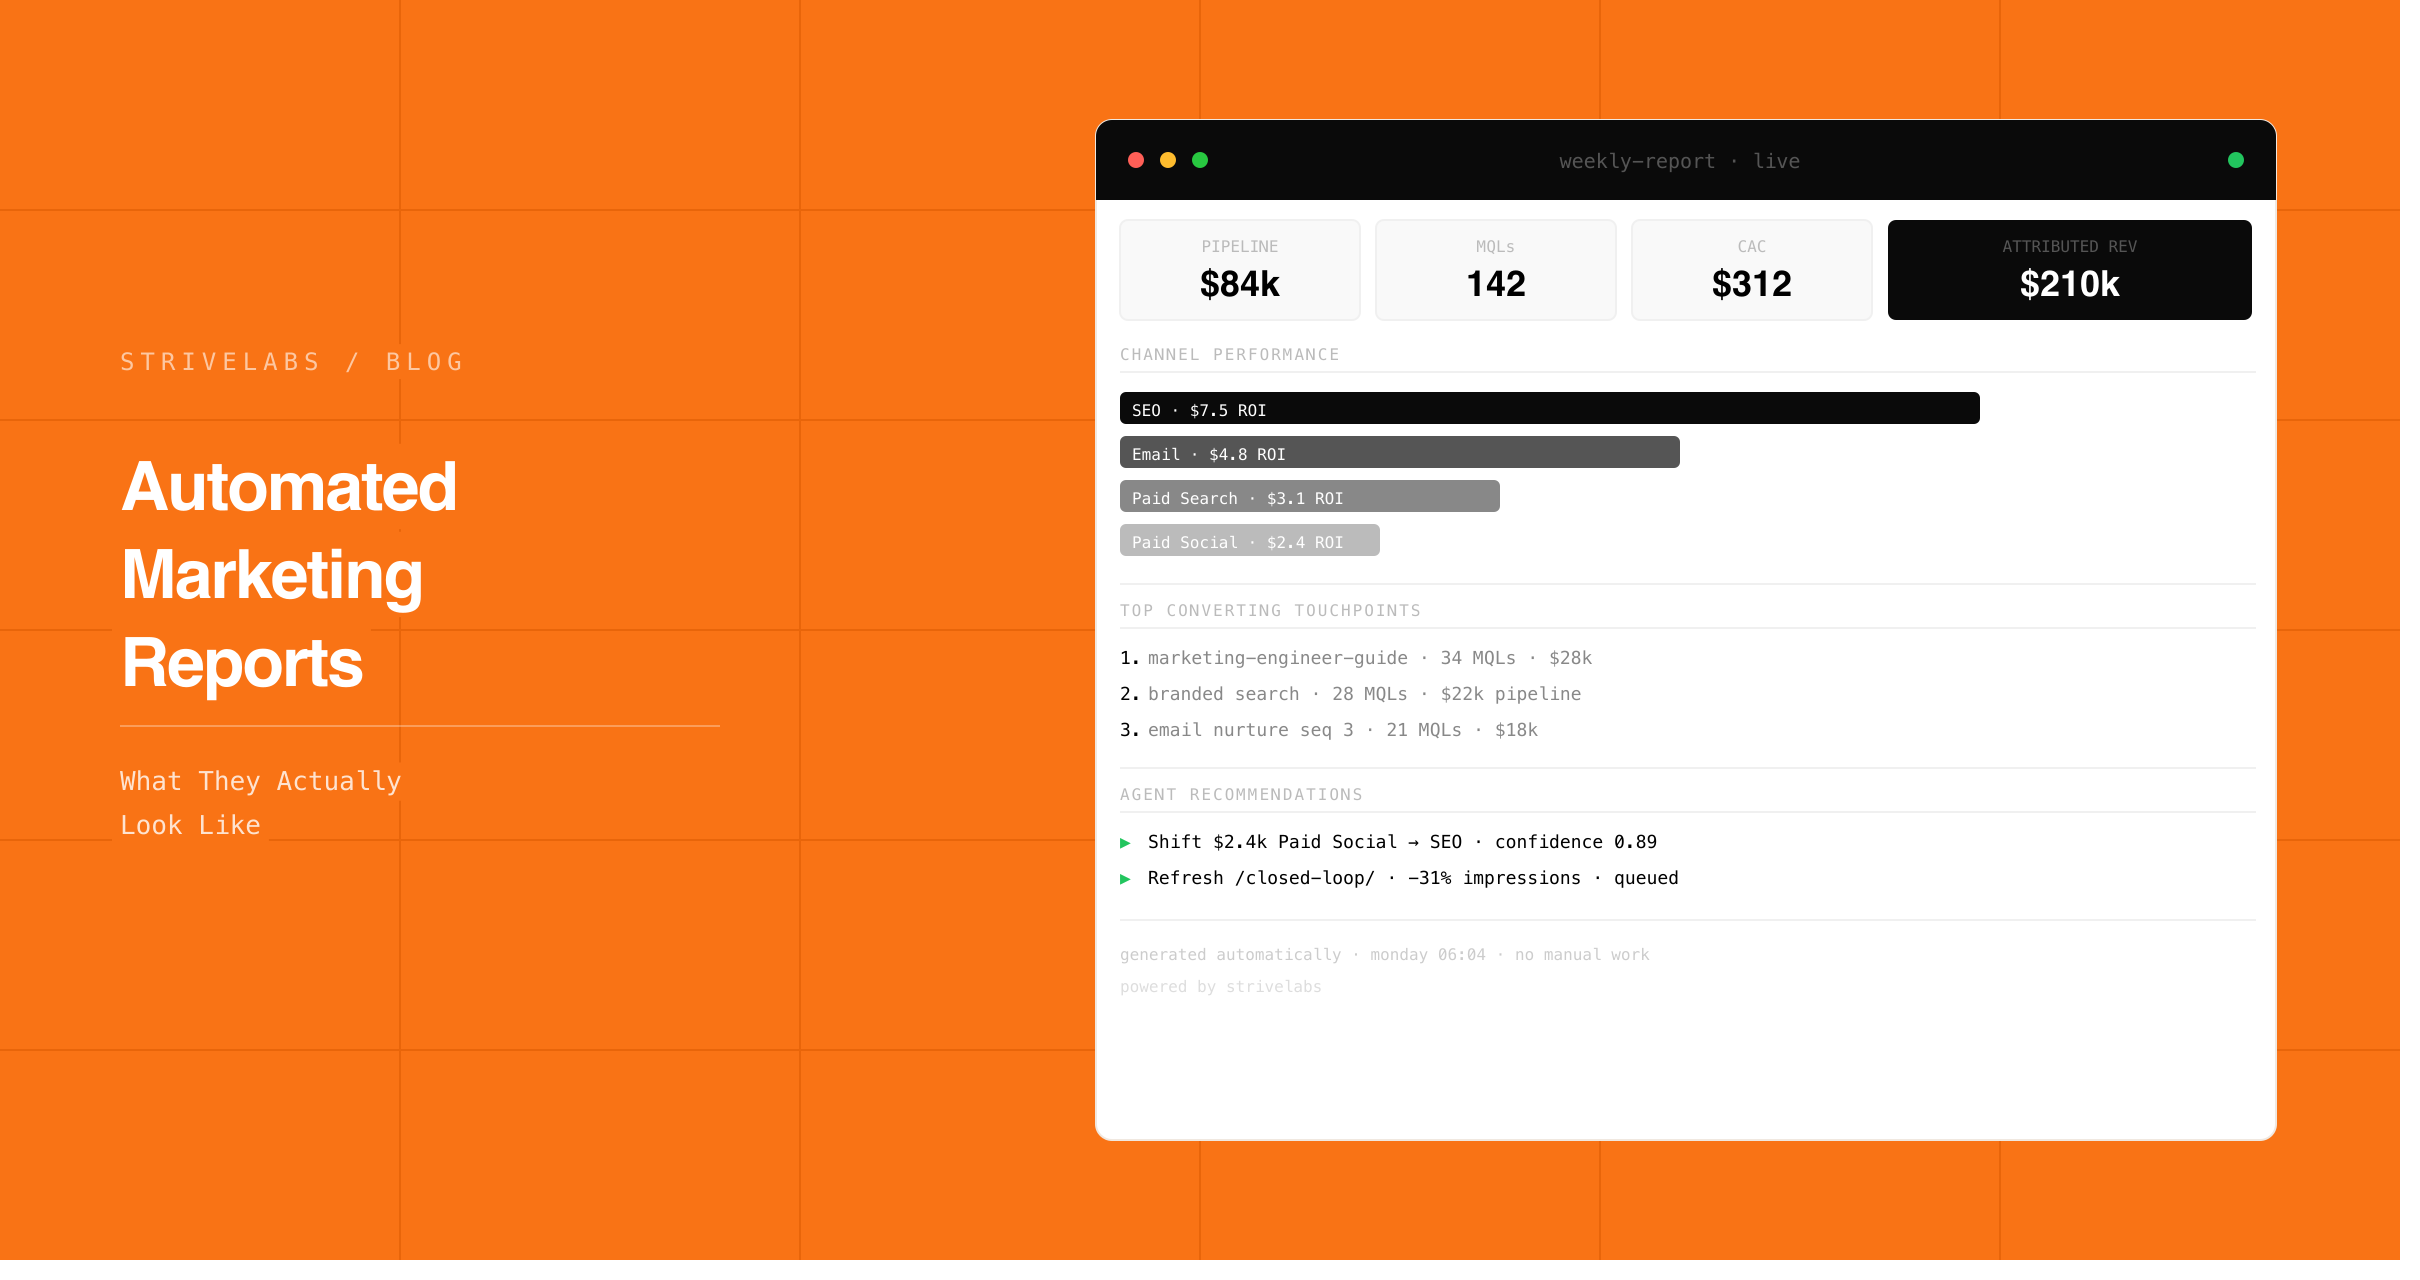
What an Automated Marketing Report Actually Contains
A well-structured automated report answers three questions leadership actually asks, not what happened, but why it happened and what to do about it.
The five core sections:
Executive summary. One sentence per channel, paid, organic, pipeline, with the single most important signal from each. Not a paragraph of context. One sentence with the key number and whether it moved in the right direction.
Paid media performance. Spend, CTR, CPC and conversion rate across Google Ads, LinkedIn and Meta, aligned to the same attribution window, the same timezone, the same campaign naming convention. Anomalies flagged automatically with the diagnosis attached.
Organic performance. Search Console impressions and clicks by page and query. GA4 sessions and conversion rate by landing page. Pages gaining or losing impressions this week versus the 30-day baseline. Content decay signals flagged with pipeline attribution context, which declining pages were generating deal attribution before they started falling.
Pipeline movement. HubSpot deal progression this week, which deals moved stages, which campaigns appeared in their attribution path, what the MQL to SQL velocity looks like versus the 90-day average. This is the section manual reports almost never include because it requires CRM data and ad platform data to be connected in the same system.
Action queue. Two to three specific recommended actions with reasoning and supporting data, budget reallocation, audience suppression, content refresh brief, ad pause. All waiting for approval before executing. Nothing in this section is automatic.
Better decisions start with better infrastructure.
Most mid-market teams pick a channel and hope. Strivelabs gives you the data to know, and the infrastructure to act on it.
Book a Demo →
How to Automate Marketing Reports Across Paid, SEO and CRM
The AI Agents for Paid Media post covers paid mechanics. The AI Agents for CRM post covers pipeline signal detection. Here is how the three layers connect in the weekly automated report:
Paid media layer:
The Strivelabs agent connects to Google Ads, LinkedIn Ads and Meta via OAuth. It reads spend, CTR, conversion rate and creative performance daily. When a metric crosses a threshold, CTR drops more than 15%, CPC spikes without a corresponding conversion improvement, a specific ad group starts cannibalising another, the agent diagnoses the cause and queues a recommended action.
The diagnosis is not just a flag. "Google Ads CTR dropped 23% on the highest-spending ad group" is a flag. "Google Ads CTR dropped 23% on the highest-spending ad group. Impressions held steady. GA4 sessions from that ad group fell 19% simultaneously. The landing page was updated on Tuesday. Probable cause: copy change reduced relevance. Recommended action: revert the landing page to the previous version and run an A/B test on the updated copy against the original", that is a diagnosis.
SEO and organic layer:
The agent reads Search Console impressions and clicks by page and query daily. It connects this to GA4 session and conversion data. Pages losing impressions on commercial intent queries, "best," "vs," "pricing," "how to", over a 90-day rolling window are flagged for the content refresh workflow.
The pipeline connection is what distinguishes this from standard Search Console monitoring. A page that is losing impressions on a generic informational query is a low-priority signal. A page that is losing impressions on a commercial intent query and was attributed to 14 deals in HubSpot last quarter is a high-priority signal. The agent makes this distinction automatically because it reads both Search Console and HubSpot simultaneously.
CRM and pipeline layer:
The agent reads HubSpot deal stages, contact activity and campaign attribution continuously. The weekly report surfaces: how many deals progressed this week, which campaigns appeared in those deals' attribution paths, how MQL to SQL velocity compares to the 90-day average, and which in-pipeline contacts are still receiving awareness ads that should have been suppressed when they entered commercial discussion.
This last signal, in-pipeline contacts still seeing awareness ads, is invisible without the CRM connection. Data integration across sales and marketing systems enables the win rate improvements Aberdeen Group quantifies at 38%, and this specific signal is where a significant portion of that improvement comes from. Suppressing awareness spend on in-pipeline contacts is budget recovery that only becomes visible when CRM and ad platform data are in the same system.
Automate Marketing Reports Without Losing Visibility or Control
The most common objection: "if the report is automated, how do I know I am seeing the right things?"
The answer is in the approval model. Every recommended action in the automated report, budget reallocation, audience suppression, content refresh brief, ad creative swap, requires explicit marketer approval before executing. The agent does not change anything in your ad accounts, HubSpot or CMS without sign-off. The audit trail for every recommendation is automatic.
What the marketer controls:
- Detection thresholds — how sensitive the anomaly detection is
- Action queue — which recommendations to approve, adjust or reject
- Data sources — which platforms are connected and what permissions they have
- Attribution model — first touch, last touch or multi-touch, applied consistently
What the agent handles:
- Daily data pulls from every connected source
- Timezone and naming convention alignment
- Anomaly detection and diagnosis
- Report assembly and narrative
- Action recommendation with supporting evidence
63% of B2B companies feel they underutilise their martech stack, on average only 42% of features are actively used, according to Gartner's Marketing Technology Survey. The underutilisation is not a tool problem. It is an ops problem, the marketer does not have the bandwidth to use the tools they already have because they are spending it on manual reporting. Automated reporting gives the bandwidth back.
From Data to Decision in 20 Minutes Not 4 Hours
Here is what the Monday morning review looks like with the Strivelabs automated report running:
Minutes 1-5: Read the executive summary. One sentence per channel. Understand where the week stands at a glance.
Minutes 5-10: Review the three flagged anomalies. Each one has a diagnosis and a confidence level. For two of them the diagnosis looks right, approve the recommended actions. For one of them the marketer has context the agent does not, a sales rep mentioned the competitor improved their landing page, which explains the CTR drop better than the "creative fatigue" diagnosis. Reject the recommendation and note the actual cause.
Minutes 10-15: Review the pipeline section. Two deals progressed to a late stage. Both came from the same Google Ads campaign. Note this for the quarterly budget review. One in-pipeline contact is still in the awareness ad audience. Approve the suppression recommendation.
Minutes 15-20: Review the action queue. Three items waiting for approval. Approve two. Adjust the budget reallocation amount on the third before approving.
Done. The marketer has made five decisions in 20 minutes that would have taken four hours to even surface manually. The rest of Monday goes to strategy, experiments and the work that requires judgment.
What You Do With the 4 Hours Automated Reporting Gives Back
| Previous Friday | With automated reporting |
|---|---|
| 2 hours aligning data from 5 platforms | Agent aligns data continuously |
| 1 hour building attribution view | Pipeline attribution automatic |
| 45 minutes writing narrative | Agent generates narrative |
| 15 minutes formatting the deck | Report formatted automatically |
| Total: 4 hours assembly | Total: 20 minutes review |
The four recovered hours go to three things:
Experiments. Three additional hours per week is three additional experiments. Over a quarter that is 39 experiments a team running manual reporting could not run. The Marketing Experimentation operating model shows what high-velocity experimentation looks like when the reporting infrastructure supports it.
Pipeline decisions. With the pipeline section of the automated report visible every Monday, budget allocation decisions happen based on what is actually generating revenue, not on what looked good in a dashboard three weeks ago.
Strategy. The marketer's job should be strategic direction, experiment design and stakeholder alignment, not data entry. Automated reporting returns the job description to what it should be.
How Strivelabs Automates Your Weekly Marketing Report
Strivelabs connects to Google Ads, LinkedIn Ads, Meta Ads, HubSpot, Search Console and GA4 via OAuth in under five minutes per integration. No engineering required.
Once connected the agent begins building the baseline, establishing the 30-day performance averages that anomaly detection runs against. The first automated report is ready within 24 hours. From that point the weekly report builds automatically every Monday morning.
| Manual weekly report | Strivelabs automated report | |
|---|---|---|
| Build time | 4 hours | 20-minute review |
| Data sources | Manual exports | Direct OAuth connections |
| Anomaly detection | Human spot-checking on Friday | Continuous automated detection |
| Recommended actions | Written by analyst post-hoc | Agent-generated queue awaiting approval |
| Pipeline connection | Manual CRM reconciliation | Automatic HubSpot deal mapping |
| Human involvement | Data assembler | Decision maker |
The marketing engineer function, delivered as software.
See how Strivelabs gives mid-market teams the operational capacity without the hiring cost.
Explore Strivelabs →
Frequently Asked Questions (FAQs)
How does automated marketing reporting ensure data accuracy?
The agent connects directly to each platform's API, Google Ads, LinkedIn, HubSpot, Search Console, GA4, and applies consistent normalisation rules: timezone standardisation, UTM convention alignment, attribution window consistency. This eliminates the manual alignment errors that occur when data is exported and joined in a spreadsheet. Source totals are validated against native platform numbers on every pull. If a connector fails, an alert fires before the report runs.
What is a human-in-the-loop system in marketing report automation?
The agent assembles the report, diagnoses anomalies and generates recommended actions, but nothing executes without the marketer's explicit approval. The system surfaces a budget reallocation recommendation with its reasoning and supporting data. The marketer reads it, agrees or adjusts, and approves. The agent executes. No action touches an ad account, HubSpot record or CMS without sign-off. The audit trail for every decision, who approved what and when, is automatic.
Will I lose visibility if my marketing reports are automated?
The opposite. Manual reports show what you had bandwidth to pull. Automated reports show everything, continuous anomaly detection across all connected platforms, pipeline attribution connecting campaign data to HubSpot deal records, and content decay signals from Search Console. The marketer sees more, not less, because the agent monitors continuously rather than weekly.
What marketing reporting metrics matter most for B2B SaaS leadership?
Three metrics connect marketing activity to revenue: pipeline influenced by marketing, which campaigns appear in the attribution paths of deals that progressed or closed; MQL to SQL velocity, how fast marketing-generated leads convert to sales-qualified opportunities; and CAC payback by channel, which channels generate pipeline that closes fastest. These require CRM data connected to campaign data. The Marketing Attribution post covers how to build the model correctly for a 90-day sales cycle.
How quickly can you see results from automated marketing reporting?
The first automated report is ready within 24 hours of connecting your data sources. Time saving, from four hours to 20 minutes, is visible in the first week. Pipeline attribution improvement, seeing which channels are actually driving closed revenue, becomes clear within one full sales cycle, typically 60-90 days for B2B SaaS.
Related Posts

What Is Creative Fatigue and How to Detect It Before It Costs You
Creative fatigue costs 35% CTR before dashboards catch it. Here are the frequency thresholds and leading indicators for Google, LinkedIn and Meta that let you act before the damage compounds.

How to Build a Negative Keyword List That Stops Wasting Budget
Most Google Ads accounts waste 15 to 25% of budget on irrelevant searches. Here is the eight-category B2B SaaS negative keyword framework and the weekly review process that keeps it compounding.

8 AI Search Visibility Mistakes B2B Teams Are Making Right Now
96% of B2B companies are invisible in AI search. Here are the eight structural mistakes causing it and the specific fix for each one a lean team can implement this week.