Marketing Reporting Automation: What It Looks Like
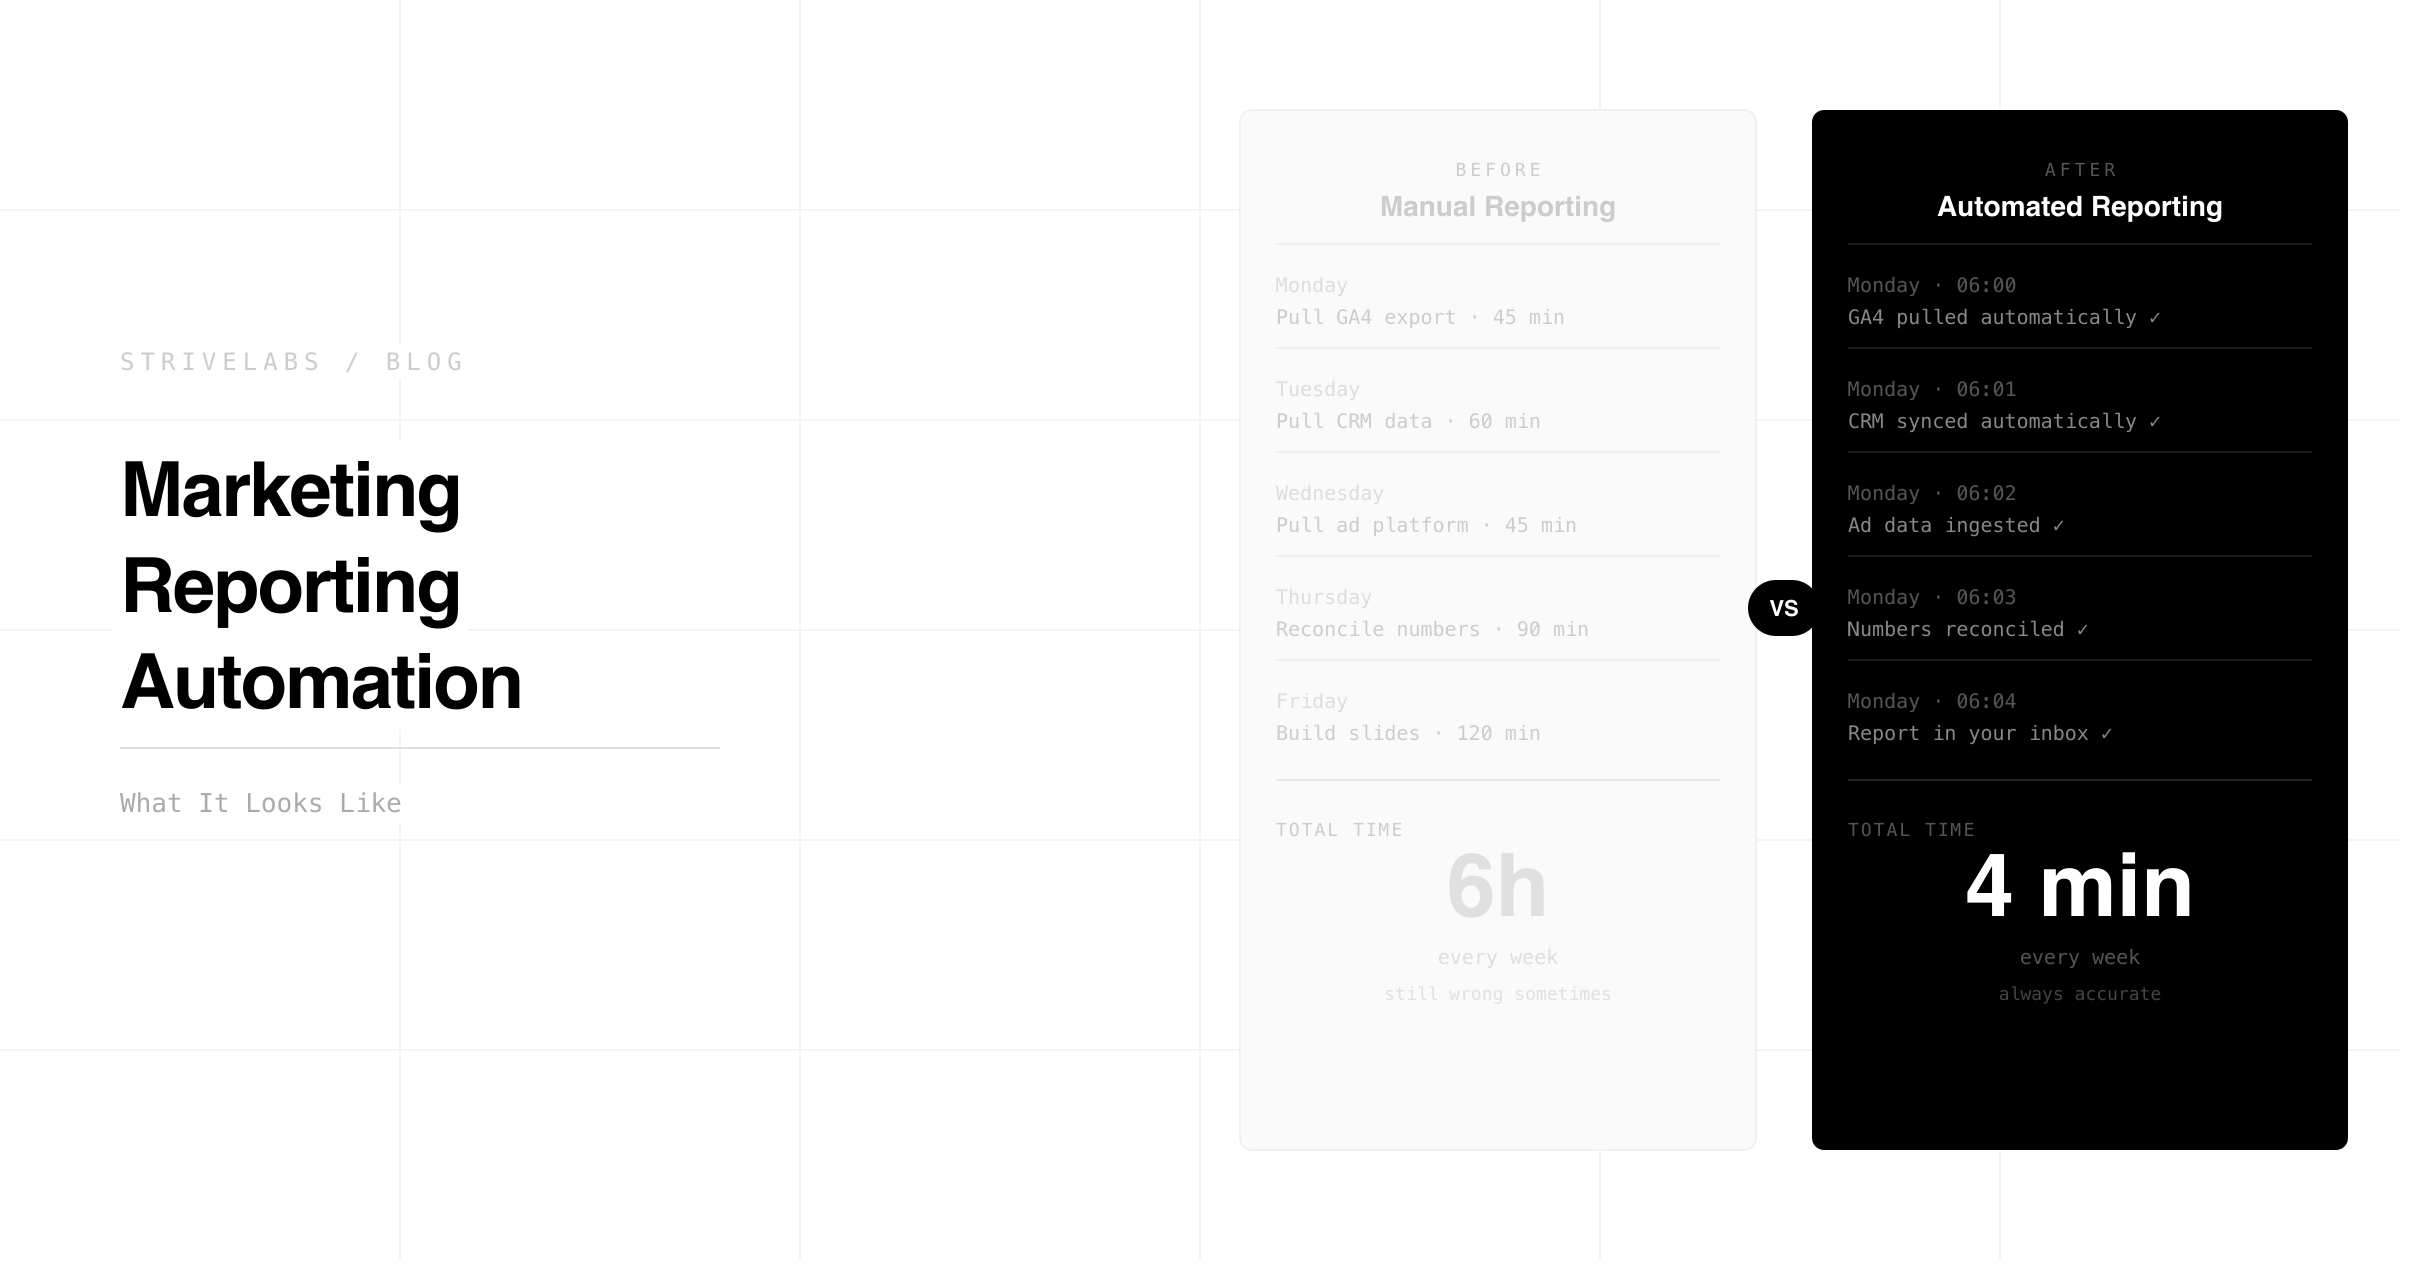
Every Friday afternoon, the same ritual. Five browser tabs open. Google Ads export. LinkedIn campaign data. Search Console pull. GA4 sessions. HubSpot pipeline. Four hours of copying, cleaning, aligning date ranges, fixing UTM mismatches, and building a narrative that is already partially stale by Monday morning when leadership asks for an update.
Over 40% of CMOs who push for larger budgets will lose influence with the C-suite by 2027 because they cannot demonstrate clear ROI, and the root cause is not strategy. It is the reporting infrastructure underneath the strategy. Teams that cannot show marketing's contribution to the pipeline clearly and quickly are losing budget conversations they should be winning.
The problem is not that marketing teams lack data. It is that assembling the data manually takes four hours that should be spent acting on it. Automated marketing reporting fixes the assembly problem, not by adding another dashboard, but by connecting your data sources, building the report automatically, and surfacing what changed and why before you open your laptop.
This post covers what automated marketing reporting actually looks like for a B2B SaaS team running Google Ads, LinkedIn, HubSpot, Search Console and GA4, and what you do with the four hours you get back.
At a Glance
-
The four-hour Friday report is a data assembly problem, not a reporting problem. Automated marketing reporting fixes the assembly, the marketer reviews and approves in 20 minutes.
-
Three things marketing reporting must show that manual reports almost never get right: pipeline impact by channel, experiment velocity, and anomaly detection with recommended actions.
-
Human approval stays at every step. The Strivelabs agent builds the report and surfaces recommended actions. The marketer reviews and approves before anything changes.
-
The four hours recovered from manual reporting is not a soft benefit. It is three additional experiments per week, which compounds into a measurable performance advantage over 90 days.
Why Marketing Reporting Takes 4 Hours Every Friday
The time does not go into writing the report. It goes on assembling the data before writing can start.
Google Ads, LinkedIn, HubSpot, Search Console and GA4 all handle dates differently. They use different attribution windows. UTM parameters are inconsistently named across campaigns. A campaign that appears in Google Ads as "Q2_Brand_EMEA" appears in HubSpot as "q2-brand-emea" and in GA4 with no UTM at all because someone forgot to tag the landing page. Before a single insight can be written, two hours disappear into alignment.
Then there is the narrative. Turning raw numbers into pipeline signals, CAC, MQL to SQL velocity, cost per pipeline dollar by channel, requires cross-referencing CRM data against ad spend data against organic performance data. Without a unified view, the marketer does it manually. Every week.
The result: by the time the report reaches leadership on Monday, the data is 72 hours old. A campaign that started underperforming Thursday is already three days into waste. A content page that lost ranking signals on Wednesday has been losing traffic for five days before anyone noticed.
What Marketing Reporting Actually Needs to Show — and Doesn't
Most marketing reports answer one question: what happened last week? The right question is: what should we do differently this week?
That distinction requires three things most manual reports never have:
Pipeline impact by channel
Not impressions, not clicks, not MQL volume. Which specific channels are generating the pipeline that closes? In a 90-day B2B SaaS sales cycle, a weekly report that only shows top-of-funnel activity is measuring the wrong thing. The closed loop marketing architecture, connecting paid, SEO and CRM data into one view, is what makes pipeline attribution visible in a weekly report.
Experiment velocity
How many tests ran this week and what did they produce? A marketing report that does not show experiment output is not measuring the team's most important growth mechanism. 59% of marketers review performance on a daily or weekly basis according to HubSpot's State of Marketing 2026, but reviewing performance and running experiments on that performance are different things. The report should show both.
Anomaly detection with recommended actions
A report that shows a CTR dropped is useful. A report that shows a CTR dropped, diagnoses three possible causes, and recommends a specific action with its reasoning is a decision tool. Most manual reports stop at showing. The Agentic Marketing Engine does not stop at showing.
Better decisions start with better infrastructure.
Most mid-market teams pick a channel and hope. Strivelabs gives you the data to know, and the infrastructure to act on it.
Book a Demo →
The Three Reporting Failures Killing B2B SaaS Marketing Teams
Failure 1 — Data integration breakdowns
An API key expires on a Thursday. The automated export runs Friday morning and pulls incomplete data. The marketer does not notice until they are two hours into building the report and the totals do not match. They spend another hour diagnosing the source of the discrepancy.
This happens because most reporting setups are brittle, they depend on manual exports, scheduled syncs, and UTM conventions that are not enforced at the campaign level. When one piece breaks, the whole report breaks.
Failure 2 — Attribution errors
A contact clicks a Google Ad, downloads a whitepaper via organic search three weeks later, and books a demo directly. The CRM attributes the demo to "direct." The paid team has no credit. The content team has no credit. Leadership concludes paid and content are underperforming and reallocates budget to the channel that got the last click, which may have contributed nothing to the decision.
Multi-touch attribution at the report level is what connects every touchpoint to the deal. Without it, budget decisions are made on incomplete data every week.
Failure 3 — Operational delay
The report takes four hours to build on Friday. Leadership reads it Monday. A campaign that started declining Wednesday has been running for five days before the report surfaces. By the time a decision is made and an action is taken, the problem has compounded for another two or three days.
In a 90-day B2B SaaS sales cycle, every day of delay in detecting and acting on a performance signal costs pipeline. The marketing experimentation operating model requires a reporting system that catches signals fast, not one that surfaces them after a week.
What Automated Marketing Reporting Looks Like in Practice
Automated marketing reporting does not mean another dashboard. It means the report builds itself, pulling data, aligning it, surfacing anomalies, and recommending actions, while the marketer reviews and approves.
Inside Strivelabs, here is what that looks like:
Data connection runs continuously
Strivelabs connects to Google Ads, LinkedIn Ads, Meta Ads, HubSpot, Search Console and GA4 via OAuth. Once connected, data flows continuously, and not in weekly exports. UTM normalisation runs automatically so "Q2_Brand_EMEA" and "q2-brand-emea" resolve to the same campaign record across every platform.
The agent builds the report automatically
Every Monday morning, before the marketer opens their laptop, the weekly report is ready. Paid performance across all three ad platforms. Organic performance from Search Console and GA4. Pipeline movement from HubSpot, which deals progressed, which campaigns appeared in their attribution path, what the MQL to SQL velocity looks like this week vs last.
Anomalies are diagnosed, not just flagged
A 23% CTR drop on the highest-spending Google Ads group is not just flagged as a drop. The agent investigates. Is it creative fatigue, the ad has been running for 21 days and the audience has seen it too many times? Is it a competitor increasing bids on the same keyword? Is it a landing page conversion drop rather than a click drop? The agent generates three hypotheses, ranks them by confidence, and drafts a recommended action for each.
Recommended actions wait for approval
The marketer reads the report, 20 minutes instead of four hours, reviews the anomaly diagnoses, approves or adjusts the recommended actions, and closes the tab. Every approved action is logged in an audit trail. Nothing executes without sign-off.
How the Agent Builds Paid, SEO and CRM Reports
Paid media reporting
The agent connects click costs from Google Ads and LinkedIn to lead records in HubSpot. It tracks the journey from click to MQL to SQL to deal stage, calculating the revenue each campaign has contributed to the pipeline, not just the leads it generated. When a cost per lead rises above a threshold, the agent flags it with the probable cause and a recommended budget reallocation. The marketer reviews the reallocation recommendation with the reasoning attached before approving.
SEO and organic reporting
The AI Agents for SEO post covers the full workflow, but in the weekly report context, the agent surfaces Search Console impressions and clicks by page and query over the rolling 30-day window. Pages losing impressions on high-intent commercial queries are flagged with their HubSpot pipeline attribution, showing how much pipeline that page was generating before the decline started. The report does not just show which pages are declining. It shows which declines are costing pipeline.
CRM and pipeline reporting
The AI Agents for CRM post covers the four signal types in depth. In the weekly report, the agent surfaces pipeline velocity, how fast deals are moving through stages this week vs the 90-day average, and which marketing channels appear most frequently in the attribution paths of deals that progressed. This is the number that justifies the marketing budget in the next leadership meeting.
Marketing Reporting That Connects to Pipeline, Not Just Activity
This is the section most reporting tools skip. They report on marketing activity. Strivelabs reports on pipeline impact.
The distinction: a report that shows 1,200 MQLs this week is an activity report. A report that shows 1,200 MQLs of which 340 came from organic search, 280 from Google Ads, and 180 from LinkedIn — and that the organic MQLs are converting to SQL at 2.4x the rate of paid MQLs — is a pipeline report.
Only 17% of marketing leaders feel very confident in their ability to prove marketing's contribution to business outcomes, according to Gartner research. The confidence gap is not a skills gap. It is an infrastructure gap. Teams with automated closed loop reporting, connecting marketing touches all the way through to closed revenue in HubSpot, have the numbers to walk into any budget conversation with confidence.
The Marketing Attribution post covers how to build the multi-touch attribution model correctly for a 90-day sales cycle. Once that model is in place, the weekly report does not just show what happened. It shows what to do next.
What You Do With the 4 Hours Marketing Reporting Used to Take
| Previous Friday | With automated reporting |
|---|---|
| 3-4 hours pulling, cleaning and aligning data | 20-30 minutes reviewing and approving the automated report |
| 30-60 minutes building narrative and deck | 30 minutes planning experiments based on the week's anomalies |
| Remaining time fixing data issues and discrepancies | 2-3 hours running experiments, analysing cohorts, building next week's tests |
Three additional hours per week is three additional experiments. Over a quarter, that is 39 experiments a team running manual reporting could not run. The Marketing Experimentation operating model shows what high-velocity experimentation looks like at the team level. The reporting infrastructure is what makes it possible.
How Strivelabs Runs Marketing Reporting Across Your Full Stack
Strivelabs connects to Google Ads, LinkedIn Ads, Meta Ads, HubSpot, Search Console and GA4 via OAuth in under five minutes per integration. No engineering required.
Once connected, the weekly report runs automatically. Every Monday it is ready for review, not for building. The marketer spends 20-30 minutes reading the anomaly diagnoses, reviewing the recommended actions, and approving what they agree with. Everything else happens automatically.
Three outputs every week:
Paid marketers receive: spend vs pipeline by campaign, creative fatigue alerts with recommended swaps, budget reallocation recommendations with reasoning, and week-on-week performance delta across Google Ads, LinkedIn and Meta.
Content marketers receive: Search Console impression changes by page and query, content decay alerts with pipeline attribution context showing what each declining page was generating before it started falling, and refresh briefs for the highest-pipeline decaying pages.
Leadership receives: pipeline influenced by marketing this week, MQL to SQL velocity vs 90-day average, CAC payback by channel, and marketing experiment velocity — how many tests ran and what they produced.
Every recommended action waits for approval. Every execution is logged.
The marketing engineer function, delivered as software.
See how Strivelabs gives mid-market teams the operational capacity without the hiring cost.
Explore Strivelabs →
Frequently Asked Questions (FAQs)
What is automated marketing reporting?
Automated marketing reporting connects your data sources, Google Ads, LinkedIn, HubSpot, Search Console, GA4, into a unified view, builds the weekly report automatically, flags anomalies with diagnoses, and surfaces recommended actions for the marketer to review and approve. The marketer spends 20-30 minutes reviewing instead of 3-4 hours building.
How does automated reporting fix attribution errors between Google Ads and HubSpot?
By connecting directly to each platform's API and applying UTM normalisation rules automatically, the system resolves inconsistent campaign naming across platforms. This allows ad spend to be mapped to HubSpot deal records at the contact level, showing which specific campaigns contributed to the pipeline rather than which campaign got the last click.
What marketing reporting metrics matter most for B2B SaaS leadership?
Pipeline influenced by marketing, which campaigns appear in the attribution paths of deals that progressed or closed. MQL to SQL velocity, how fast marketing-generated leads convert to sales-qualified opportunities. CAC payback by channel, which channels are generating the pipeline that closes fastest. These three metrics connect marketing activity to revenue in a way that any CFO can evaluate.
Does the agent change anything without approval?
No. Every action the Strivelabs agent recommends, budget reallocation, audience update, content refresh brief, requires the marketer's explicit approval before it executes. The agent builds the report and surfaces recommendations. The marketer decides. Nothing changes without sign-off.
How long does it take to see results from automated marketing reporting?
The first automated report is ready within 24 hours of connecting your data sources. The time saving, from 3-4 hours to 20-30 minutes, is visible in the first week. The pipeline attribution improvement, seeing which channels are actually driving closed revenue, becomes clear within one full sales cycle, typically 60-90 days.
Related Posts

What Is Creative Fatigue and How to Detect It Before It Costs You
Creative fatigue costs 35% CTR before dashboards catch it. Here are the frequency thresholds and leading indicators for Google, LinkedIn and Meta that let you act before the damage compounds.

How to Build a Negative Keyword List That Stops Wasting Budget
Most Google Ads accounts waste 15 to 25% of budget on irrelevant searches. Here is the eight-category B2B SaaS negative keyword framework and the weekly review process that keeps it compounding.

8 AI Search Visibility Mistakes B2B Teams Are Making Right Now
96% of B2B companies are invisible in AI search. Here are the eight structural mistakes causing it and the specific fix for each one a lean team can implement this week.