

Analyze · Reporting and diagnosis
One system, not four tabs.
Every chart arrives with
the reason it moved.
Analyze reads your paid spend, organic performance, CRM and site behaviour as one dataset. When a number moves it tells you which of them caused it, and recommends the change to make. You approve or reject it.
The answer is in the gap between your tools.
Attribution arguments happen because four tools each hold a quarter of the answer. Analyze holds all of it, so the question resolves instead of escalating.
Cross Channel Intelligence
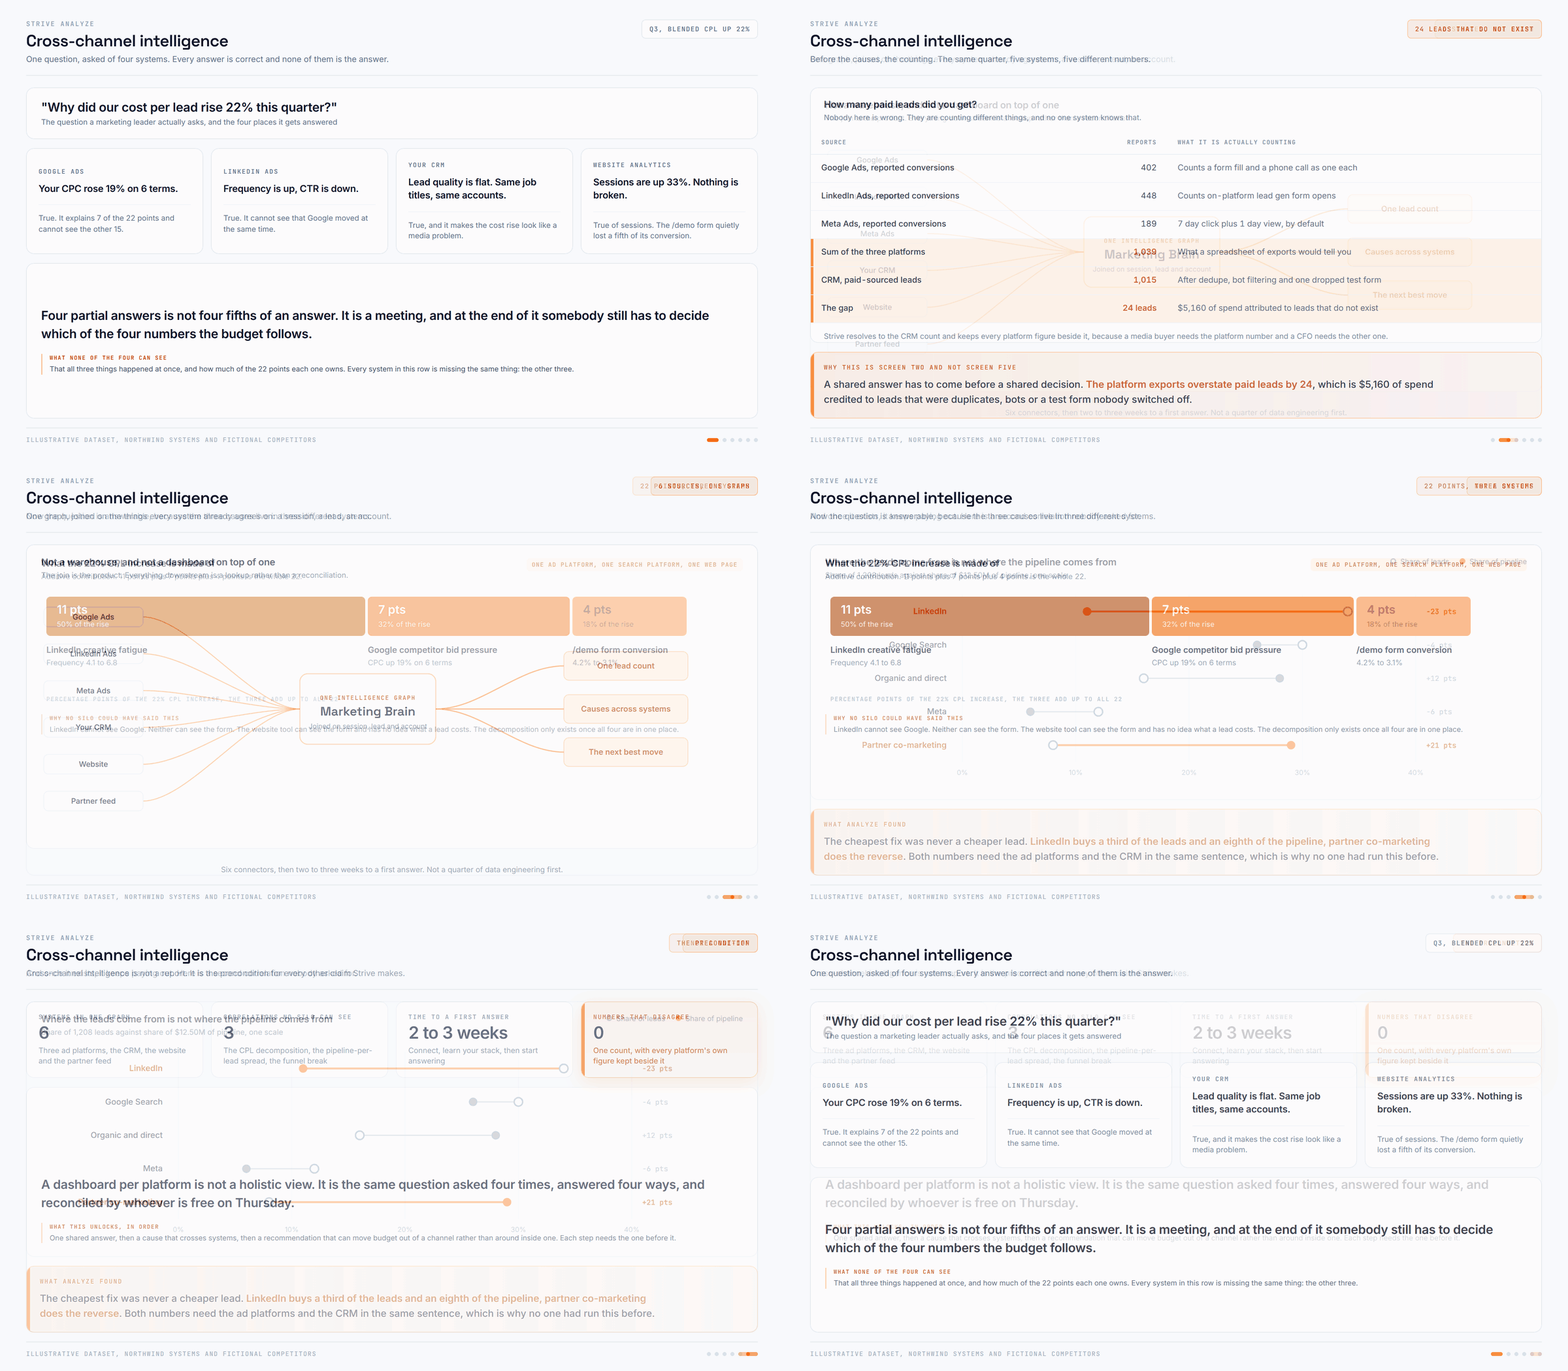
Every channel you run, read together. A CPC rise, a frequency change and a broken form are three findings in three tools and one cause in Analyze.
Ask anything, get the right chart
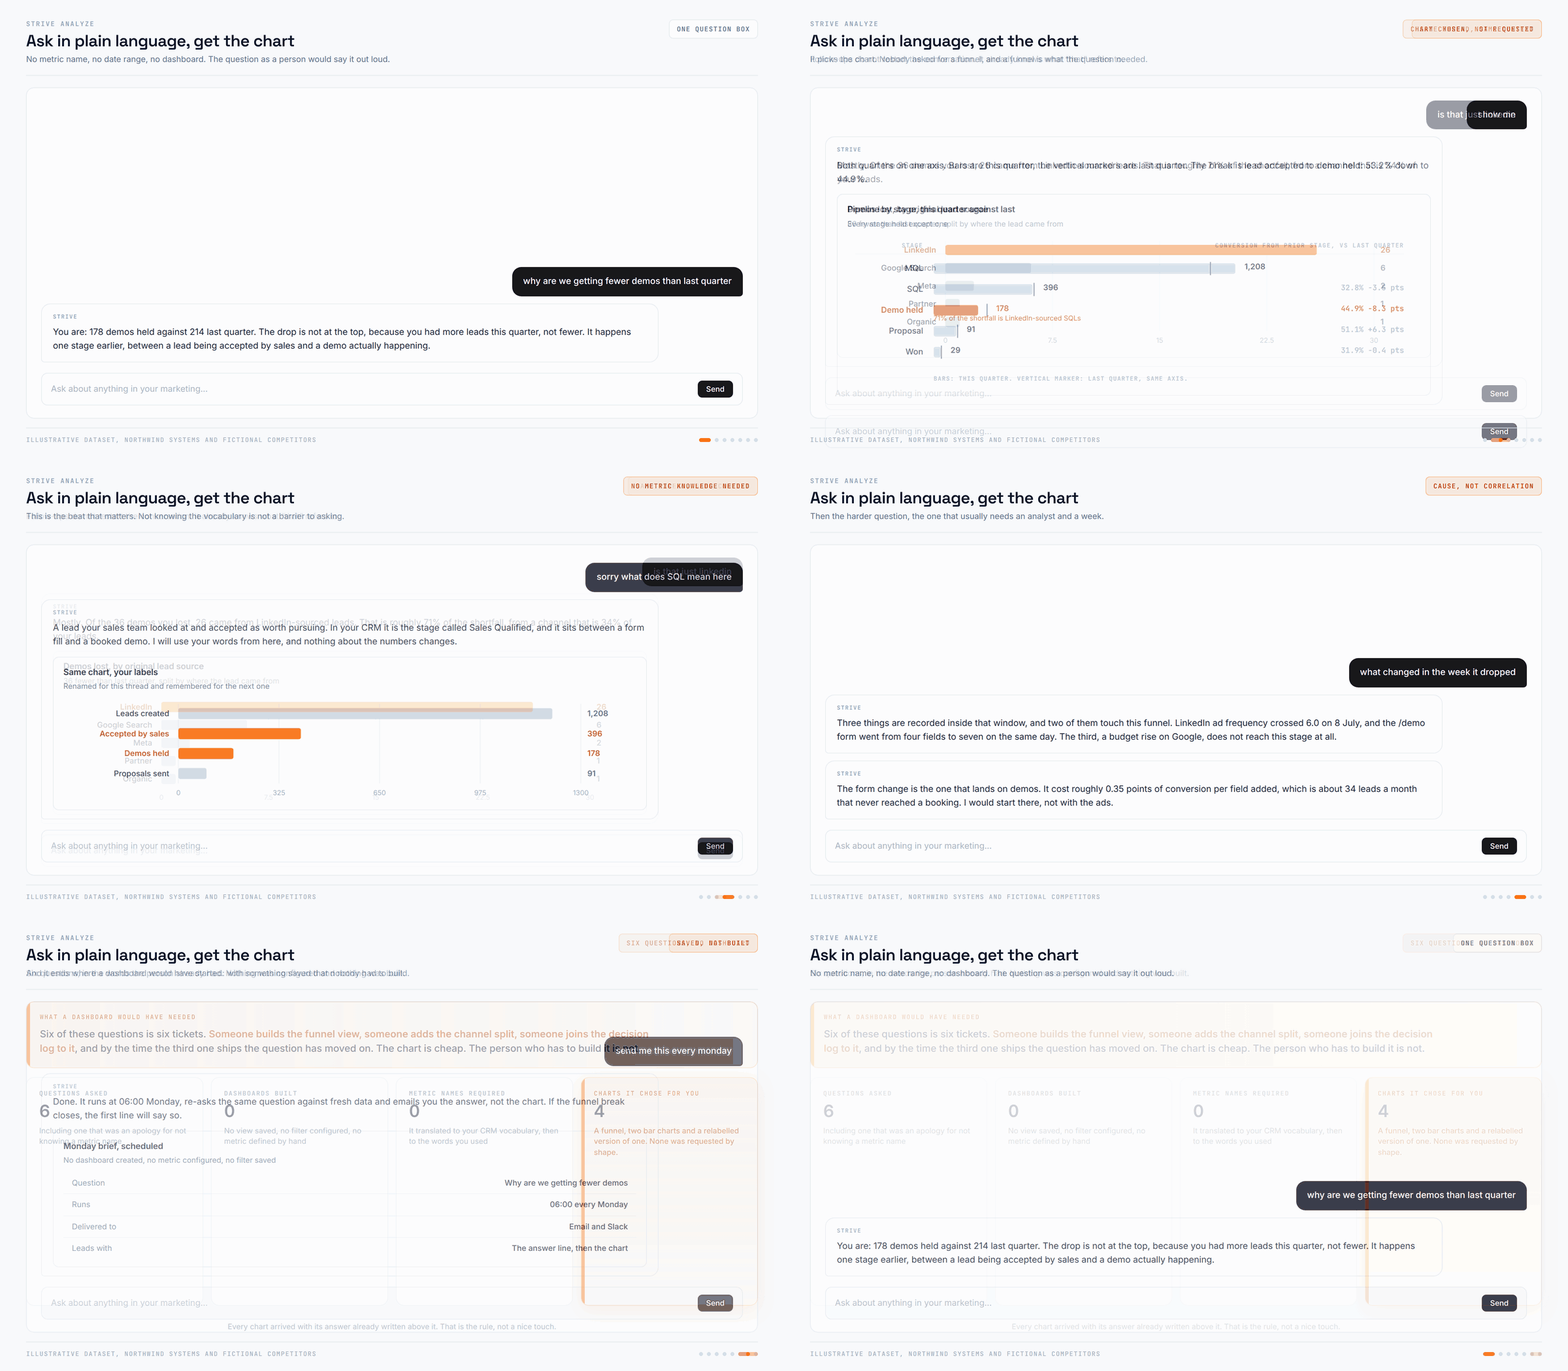
Type the question the way you'd ask a colleague. No filters, no field names, no waiting on ops. Strive picks the chart the question needed, which is often not the one you would have asked for.
Recommendations on next best move
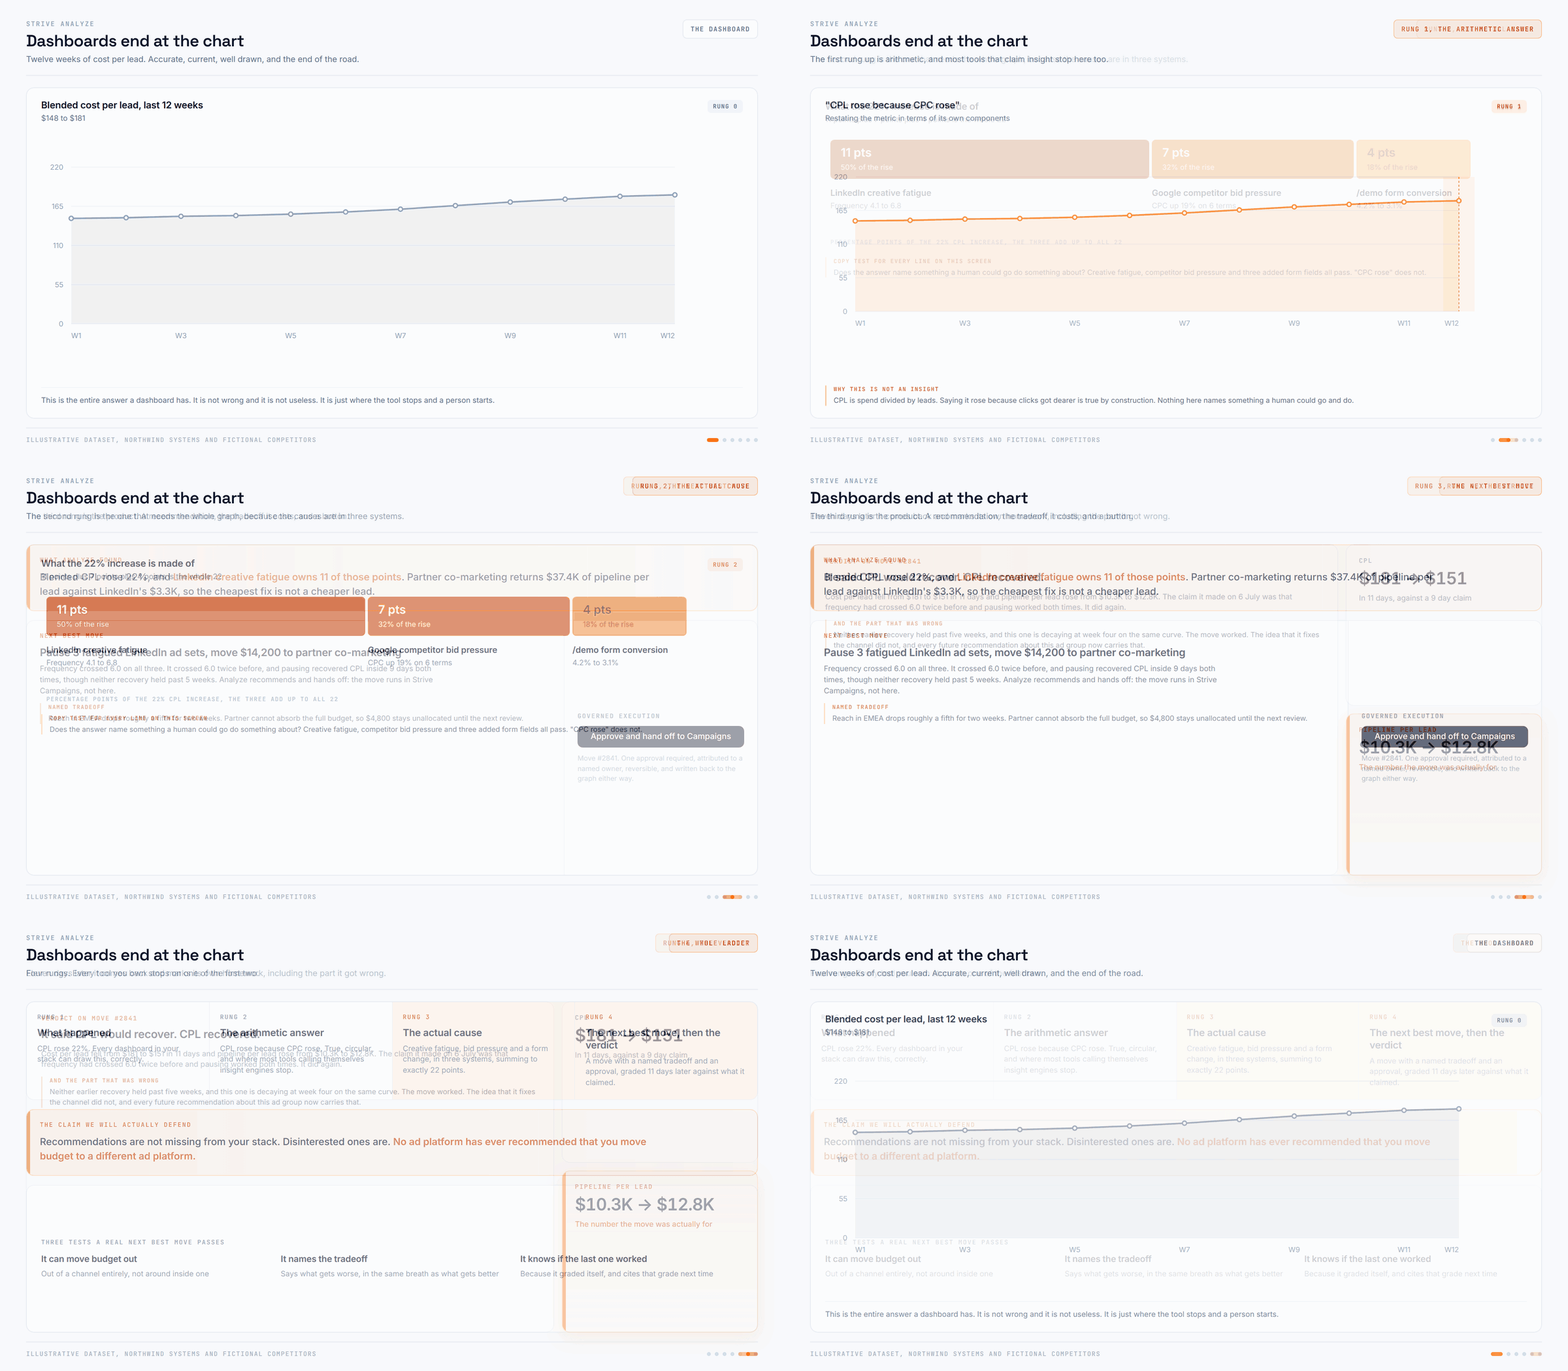
A chart tells you the number rose. That is not something anyone can act on. Strive breaks the rise into named causes, creative fatigue, bid pressure, a form that lost conversion, and puts a move against each one. Nothing runs until you approve it.

Analysis you can argue with,
because it shows its work.
Open any claim and the campaigns, channels and deals behind it are right there. Analyze reports on anything it tracks, and these are a few of them.
The whole quarter on one screen.
The quarter on one screen: spend, leads, MQLs, pipeline and blended CPL. A rise in CPL comes with the three things that caused it, sized by how much of the rise each one owns.
What is actually moving, under the noise.
Week-on-week numbers move for reasons that have nothing to do with your marketing. Trend analysis separates the seasonal and the random from the real direction, so you stop reacting to a bad Tuesday.
Where the pipeline is leaking, by stage and by source.
Conversion between every stage, split by where the lead came from. When a stage drops, the report shows which sources are behind it, so the fix lands on the channel rather than the whole funnel.
What the losses have in common.
Every lost deal carries a reason in the CRM, and reading them one by one tells you nothing. This report reads them together and shows where the losses cluster, by channel, segment and the stage they died at.
What each channel is worth once the others are accounted for.
Every channel measured on the pipeline behind it, not the leads in front of it. Where two channels touched the same deal, the report shows it rather than letting both claim the win.
FAQs
It reads your paid, organic, CRM and web data as one system. When a number moves, it finds what caused it, sizes each cause, and recommends the move to make. You can ask it anything in plain language and it builds the chart to answer it.
A dashboard shows the number. Strive Analyze explains it. Where a chart tells you CPL rose, it splits the rise into the causes underneath and names the move for the one worth fixing first.
It holds every channel in one graph, so it can see what no single platform can: that a bid change, a creative issue and a broken form all happened at once. It keeps tracing until it reaches something a person can act on, rather than stopping at "CPC rose."
No. Type the question the way you'd ask a colleague, without field names or filters. Strive Analyze works out what you meant and picks the chart that answers it.
No. Every recommendation waits for a decision, and approvals are attributed to a named person and reversible.

Autonomous, never unaccountable
Every action Strive takes carries a name, a record, and a way back.
